
If You're Reading Substacks About How You're Never Going To Get Married, You're Probably Going To Get Married

There has been a recent spree of articles about the decline of marriage, particularly focused on young, educated women who want to marry men.1 Matt Yglesias discusses some here, while Aria Schrecker’s series about dating has also gained quite a bit of attention.
Her second post is called “You’ll probably die alone”, and includes the following statement:
“If you were born in 1960, over three quarters of your peers would be married by 30. Only about 15% of people should expect to be terminally unwed.
This is the world of Sex and the City and Friends and it’s totally lost to us.”
This is false. While timing of marriage has shifted later, there is no lost world of marriage for the American upper-middle class.
Educated American women are as likely to be married as their counterparts 40 years ago.
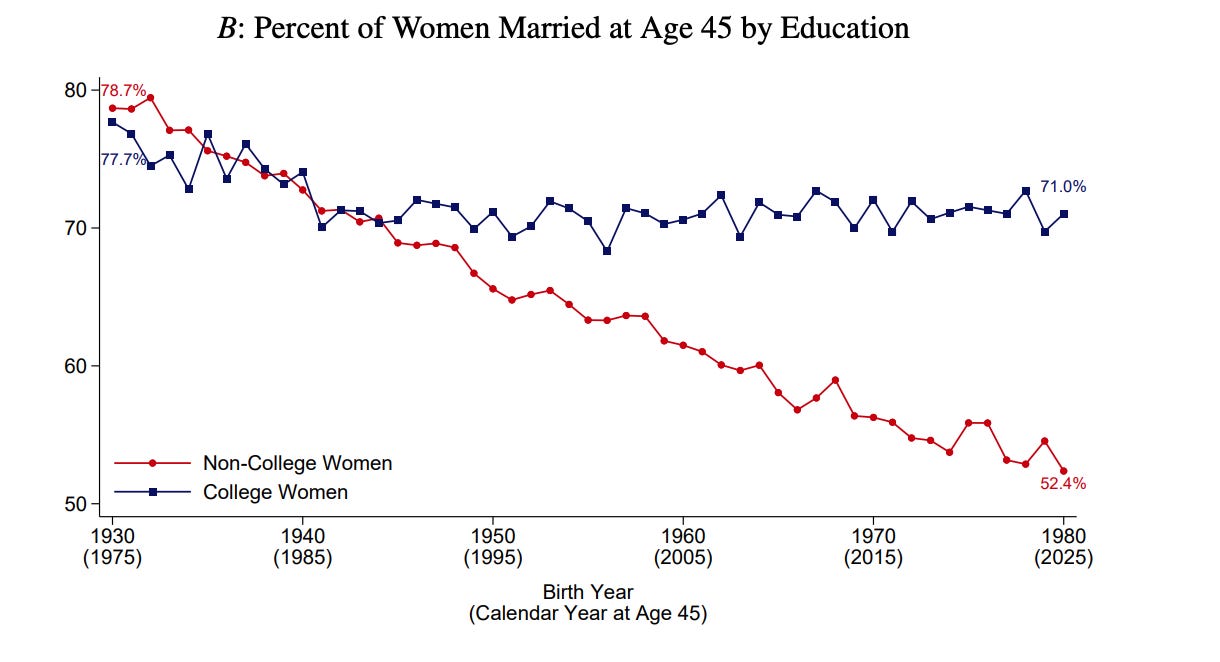
(from Scarcity of College Men and the Decline in Marriage Among Non-College Americans)
This bears some emphasis. Marriage rates for college-educated women have been flat since the cohort born in the 1940s. There is no lost world of marriage.
Note that this graph does include recent cohorts; this includes those who turned 45 in 2025.
It does not include most Millennials or Gen Z, because it is not yet possible to determine if they will be married by 45. Given the stability of this number over time, though, I’d be surprised if Millennial women suddenly decided marriage was Not For Them.
Indeed, marriage has become increasingly class-linked in the United States. Consider the following graph of the percentage of women that are married by income:
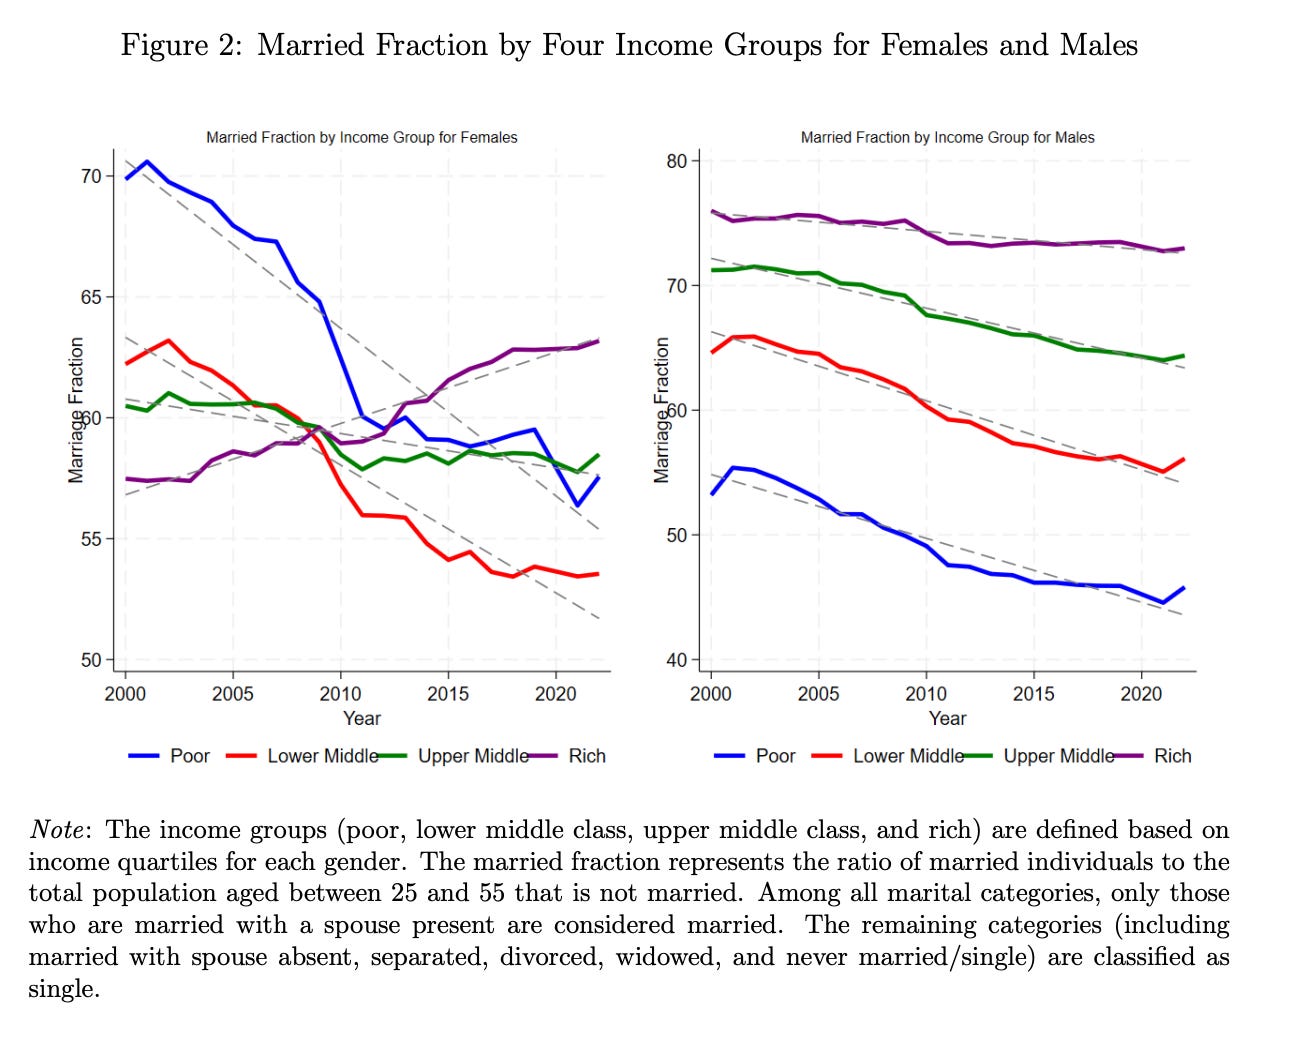
(from Marry for Money or Time? Explaining New Marriage Trends in the U.S.)
The likelihood of a woman in the top income quartile - an income of around $85k for a 30 year old in the US2 - being married3 has increased over time. If you’re an elite woman, your prospects for a successful marriage may be better than they were 25 years ago.
You’ll probably only spend a couple fewer years married than your forbears - and they’ll probably be happier ones
There is also a broader point to be made about all of these essays, even if you are not a highly educated elite. In general, most people’s goal for marriage is not marriage per se, it is a successful marriage - that is, one ideally not ending in divorce.4
Therefore, I think it is reasonable to compare the amount of your life spent married rather than one’s relative success at getting to the altar. There are several demographic changes that affect the expected number of years married besides marriage rates. At the same time that marriage rates have fallen, divorce rates have also fallen; life expectancy has increased.5
Let us compare two women: one born 1958, one born 1998. The first was born during the Baby Boom, the prototypical high-marriage-rate environment. The second is a member of Gen Z, a generation supposedly uninterested in marriage.
On average, the woman born in 1958 is more likely to marry (90% would eventually marry), and when she does marry, she marries earlier (age 22). But Gen Z marriages are much more stable - divorce rates for first marriages have declined from ~45% to ~30%.6
I calculate out the expected number of years each will spend married in the appendix, and find that the Baby Boomer would (on average) be married 33 years of her life. The Gen Z woman? About 30 years of her life.
Three fewer years of marriage is a decline, to be sure, but “a disaster, the likes of which our civilisation has never seen” feels more than a bit overdramatic. (It also seems entirely possible that relationship-years are similar, since engagements tend to be longer; few people now marry after being together six or eight months.7)
The story for college-educated women is even more positive. More college-educated women marry8 and fewer divorce. Given that college-educated women are just as likely to be married at 45 as they were for previous cohorts, and are less likely to divorce, it is entirely possible that they will spend more of their lives married.
Even including the non-college-educated, though, a 28-year-old woman today will spend just as much time married as one born in 1958. She is also considerably less likely to go through the messy, painful, expensive process of getting a divorce.
Spinsterhood As A Great Western Tradition
Someone, I’m sure, is going to point out that 70% of Gen Z college women marrying is not 100%. This is true. But 70% is… not that abnormal for a Western country. The US and the UK have never had universal marriage, especially for educated women.
In the US, the percentage of white women never married in the age range 45-54 has varied from around 4% (the Baby Boom) to around 10% (those born around 1870). Now, 17% of women have never married by 45, with rates of spinsterhood (unmarried by ~45) for college-educated women around 13%. This is an increase, certainly, but a catastrophic collapse of marriage it is not.
Historical spinsterhood rates in the UK were higher; in Tudor England, the likelihood of remaining unmarried for your entire life was about 20%. By the Victorian era, spinsterhood rates exceeded 30% in some parts of the UK. Now, about 36% of women in the UK have never married by 45. Again, this is an increase, but there is no vanished world of marriage.
Historically, marriage rates for the educated were especially low9 - only 56% of the first ten classes at Vassar married. Only 72% of the Harvard men of the classes 1867-76 married. If about three-quarters of your highly educated, elite social circle is married by 46, you are… historically pretty normal.
Lack Of A Marriage Is Not A Lack of A Relationship
You may note that all of my marriage rate data is from the US. The US is a more marrying place than the UK, likely because it is also more religious.
In the UK, cohabitation replaces some percentage of relationships that would likely be marriages in the US. I think roughly 70% of Gen Z will marry in the US; in the UK, it is likely to be closer to 50%.10 In societies like this, though, the relationship decline is considerably smaller than the marriage decline.
Currently, about 25% of non-married adults in the UK are in such non-marital but cohabiting relationships.11 Many of these will eventually become marriages, but not all will; long-term cohabitation has become more common as an alternative to marriage rather than a prelude to it.
So: those 30% of never-marrieds in the US (and perhaps 40-50% never-married in the UK)? They won’t necessarily die alone. And if what you want is the right partner to make achieving your other goals easier, cohabitation clearly counts. Cohabiting couples have many of the benefits of marriage.12
So while it is true that the UK cohort born in 1970 will see 20% fewer of its members marry than the 1940 cohort, it does not mean that those 20% will be single for the rest of their lives.13
Indeed, the total fraction of people in committed couples has been relatively stable over the last decade and a half. In the 2011 census, 57.8% of the population in England and Wales was living in a couple. The 2021 census found almost exactly the same percentage of the population living as a couple - even as marriage rates continued to decline.
Marriage, then, is not the whole story. Particularly in the UK, cohabitation without marriage is common enough that “never married” does not mean “forever alone”.
Conclusion
The data shows no collapse in relationship formation among the demographics most likely to worry about a collapse in relationship formation. Indeed, a woman today will spend about as much time married as a woman born during the Baby Boom, and she’s quite a bit less likely to get divorced.
Is it true that “a lot of beautiful and interesting women… are going to end up single”? Sure. But for the college-educated, that’s no more likely now than it was in the past - even if you don’t count the uptick of non-marital long-term relationships.
As it turns out, our settling down technology is working just fine.
Many thanks to Oscar Sykes and Aveek Bhattacharya for reading drafts of this, and for telling me to banish the math to an appendix.
Appendix
We assume that a woman born in 1958 has a life expectancy at birth of 73, and a woman born in 1998 79.14 The two women can have the following outcomes:
Never married
Married once (until death)
Married once and divorced; do not remarry
Married twice; the second marriage lasts until death
Married twice and divorced both times
For the sake of the model, I am choosing to ignore third or more marriages.15
For women born 1958, the likelihood of each category breaks down as follows:
Never married - about 10%
Married once (until death) - about 50%16
Married once and divorced; do not remarry - about 16%17
Married twice; the second marriage lasts until death - about 8%18
Married twice and divorced both times - 16%19
Calculating the length of each of these - and thus, the average marriage-years - is slightly trickier. We assume that a woman born 1958 has an average life expectancy of 73.
Never married - 0 marriage-years
Married once (until death) - married from age 22 to 73;20 51 marriage years
Married once and divorced; do not remarry - married about eight years;21 8 marriage-years
Married twice; the second marriage lasts until death - married for eight years in first marriage; four year gap between marriages; second marriage starts age 34 and ends at 73 and thus lasts 39 years; contributes a total of 47 marriage-years
Married twice and divorced both times - first marriage is eight years; second is seven; 15 marriage years
Therefore, the average number of marriage-years for a woman born 1958 is 33.22
Let’s consider a woman born 1998, marrying in 2026, at age 28.
We also know that the risk of divorce per year of marriage is now about two-thirds what it was in the 1980s. We know that about 45% of first marriages in the 1980s ended in divorce; therefore, I estimate that 30% of modern first marriages will end in divorce.23
Our categories are:
Never married - perhaps 30%
Married once (until death) - about 49%24
Married once and divorced; do not remarry - about 8%25
Married twice; the second marriage lasts until death - about 7%26
Married twice and divorced both times - about 6%
The expected marriage-years for each category are:
Never married - 0 marriage-years27
Married once (until death) - married from 28 to 79; 51 marriage-years. Note that this is the same number of expected marriage-years for the 1958 cohort, even though marriage is later; life expectancy gains completely offset this.
Married once and divorced; do not remarry - as above, eight marriage-years
Married twice; the second marriage lasts until death - eight marriage-years from first marriage; second marriage with similar divorce/remarriage timing will now occur at age 40, meaning the second marriage now lasts 39 years. Total of 47 marriage-years.
Married twice and divorced both times - fifteen marriage years
This woman’s expected marriage-years is therefore 30.28
So for all women, the number of years of marriage has declined about three years, or about 4% of her lifetime.
I’m not quite sure why it’s all addressed at women, since the men are also involved in these marriages, but nonetheless, they all are.
This is including both men and women, so presumably would be lower for just women.
This is at least partially because divorce is class-linked; the richer you are, the less likely you are to get divorced and the more likely you are to still be married if you have ever gotten married.
Most people do not enjoy getting divorced, or if they do, it is because their marriage was extremely bad.
Given this, one might expect selectivity of marriage and search time to increase, because you’re stuck with your partner for longer.
Overall divorce rates are more like 50% and 35%, but first marriage divorce rates are lower than overall rates.
Hi mom and dad! I’m glad it worked out for you, but if I tried that, you’d think I’d gone insane.
If you are wondering why only 71% of college-educated women are married in the first group and yet I assume 70% of all women will marry (even though college-educated women are a more marrying group) - note that the first graph includes only women who are still married at age 45, not those that have ever married.
This is no longer true; you are now more rather than less likely to get married with more completed education.
I’ve previously argued that the 1990 cohort will end up around 60% ever married; Gen Z is likely to be lower.
50.5% of adults were not married or civil partnered in 2024; 12.9% of all adults are in a cohabiting relationship but not married. Thus, around a quarter of unmarried people are currently cohabiting with a partner.
Not all; your cohabiting partner doesn’t automatically get medical power of attorney. But also: you don’t have to give them half your 401(k) if you split up.
Data on cohabitation is worse than data on marriage, largely because you are not required to tell the government much about your live-in partner.
This is life expectancy at birth, so realized life expectancy for the 1958 cohort is likely to be slightly higher, but it gives me an apples to apples comparison for the 1998 birth cohort.
In general, marriages beyond #2 are unlikely to last.
About 45% of unions in 1980 would end in divorce, so 55% would persist. I can’t find data on this cohort split by education; I use the overall rate because 1) fewer people in the 1980 marriage cohort were college-educated, 2) gaps in marriage dissolution rate by education level have appeared in more recent decades. Since 90% of women entered a first marriage, 55% * 90% would have a first marriage lasting until death.
90% marry * 45% divorce * 40% do not remarry
90% marry * 45% divorce * 60% remarry * 33% of those unions survive. Note that the last figure is estimated; in general, second (and third and fourth and…) marriages are less likely to last, with a dissolution rate about 50% higher than first marriages. Thus, I impute a divorce rate of about 67% for this cohort.
90% marry * 45% divorce * 60% remarry * 67% divorce again
Men have a lower life expectancy than women, and on average, a man in a heterosexual marriage is slightly older, so on average, women outlive their spouses.
I wasn’t able to find cohort-specific data on first marriage length or remarriage timing.
51 * 0.49 + 0.16 * 8 + 0.08 * 47 + 0.16 * 15
70% marry * 70% stay married
70% marry * 30% divorce * 40% do not remarry
70% marry * 30% divorce * 60% remarry * 47.5% of those unions survive. Second marriages appear to be more similar between cohorts. Again, about 60% of those who divorce will remarry. I assume the percentage dissolution increase is similar between cohorts, so I estimate that likelihood of the second marriage ending is now 52.5% and survival rate is 47.5%.
Note that this number is quite likely to contain some non-zero number of cohabitation years, as cohabitation without marriage is much more common now than it was 40 years ago. But we’re discussing marriage-years, so zero it will remain.
0.49 * 51 + 0.08 * 8 + 0.07 * 47 + 0.06 * 15
great title
What's the causal effect of reading substack posts on "If You're Reading Substacks About How You're Never Going To Get Married, You're Probably Going To Get Married"?